Powercode contains a powerful network monitoring system that allows you to collect historical and real time statistics on a variety of devices. The monitoring system runs on both the Powercode management server and the Powercode BMU. The BMU is responsible for collecting data from the network and delivering it to the management server for processing and storage.
It is important to understand two basic concepts in Powercode to understand how the monitoring works – Device Probes and Notifiers.
Device Probes
A device probe is a function that collects data from a device. This collection mechanism can either be ICMP (ping) or SNMP. Any data collected by a probe is used to modify the status of a device as well as being stored historically for review.
Creating a device probe is easy. Navigate to Network -> Network Monitoring -> Device Probes.

This page shows you a list of existing probes and allows you to add a new probe. Click Add New Probe.
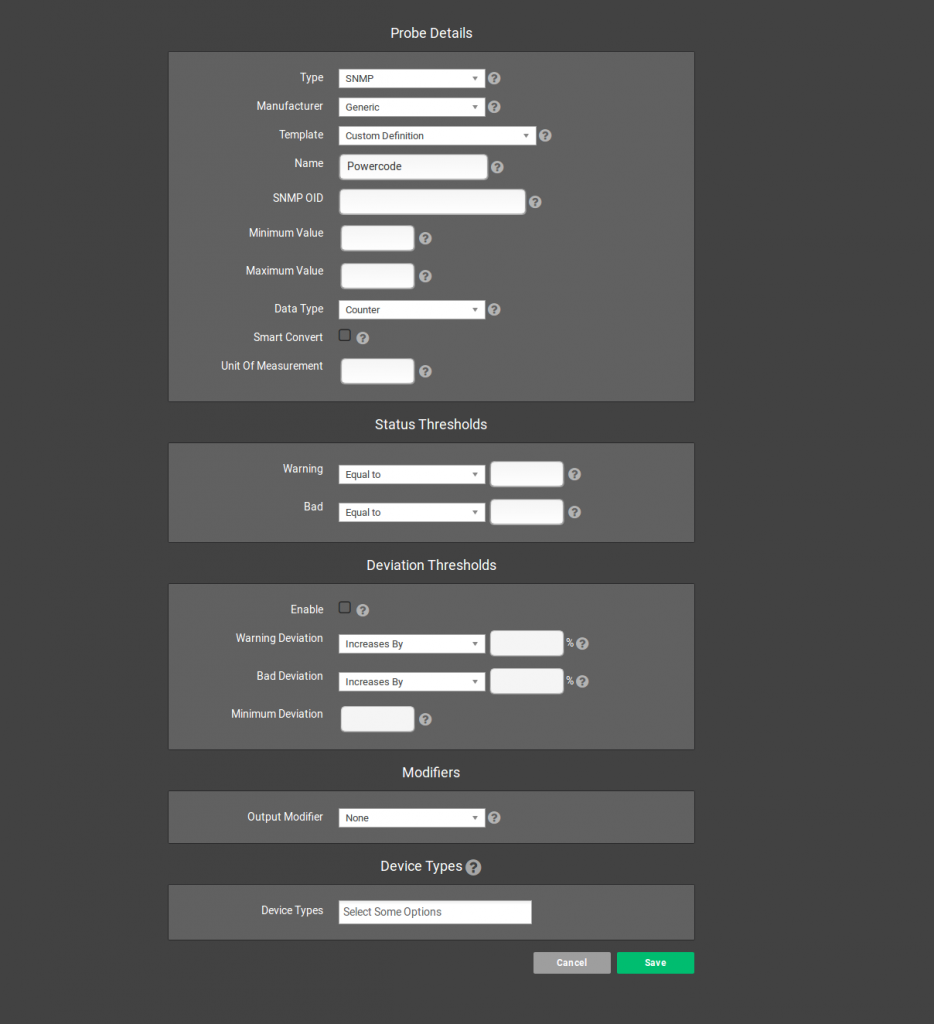
When adding a probe, you have a number of settings you can manipulate. You can select the Type of probe (ICMP, SNMP or SNMP throughput), enter the values that set the Threshold of the probe and select specific Device Types that the probe should be automatically associated with.
The three types of probes are SNMP, ICMP, and SNMP Throughput. An SNMP probe performs an SNMP query against a network device and retrieves information. All devices have different information available via SNMP – for example, a router may expose data about it’s CPU usage, memory usage or temperature via SNMP. A radio may expose information about it’s current frequency, data rate or connected clients. An ICMP probe sends multiple pings to a device and tracks the round trip (latency) as well as the number of dropped packets (packet loss). An SNMP throughput probe gives you a simple method of collecting bandwidth usage data from an Ethernet interface and automatically upconverting it from bits to kilobits to megabits (all the way to yottabits, if you have a fast enough router..) as well as an easy method of identifying the interface you want to monitor by giving a scanning tool you can use on an active device.
There are a number of templates built in for SNMP probes – use the Template drop down to select one or define your own. When defining a probe, it is important to pay attention to the Status Threshold configuration options – these define the returned values that will dictate a probe setting a device into a particular status.
For example, if you have an SNMP probe that collects CPU usage as a percentage from a router, you may want to set the Good status threshold to Less Than 50. Perhaps you set the Warning threshold to Greater Than 49 and the Bad threshold to Greater Than 75. This will mean that a CPU usage of 34% will equal a good status and a CPU usage of 50% will equal a warning status. It is important to note that thresholds apply from worst to best, with worst having the highest precedent. This means that if you set a Bad to Greater Than 50 and Good to Less Than 75, a CPU usage of 60% would equal a bad status.
Configuring any type of probe will also let you select any device types to automatically associate the probe with. If you select device types, the probe will be automatically associated with all current devices of that type as well as all future devices added. Probes can also be added manually to specific devices if desired.
Now let’s take a look at a device that is being actively probed.
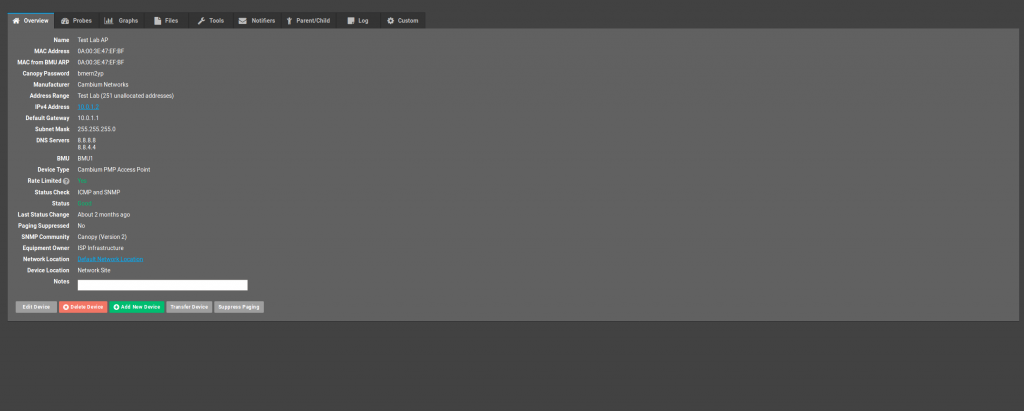
Viewing a device gives you a series of tabs that contain device specific data as well as probe results. Before a device can be probed, it must pass its Status Check. If a device fails the status check, no probes will be run. This is important to realize as having no status check set will also cause a device to not be probed.
An active status check can be one of three options – SNMP, ICMP and ICMP and SNMP. An SNMP status check will run a standard SNMP query on the device. ICMP will send 10 pings. ICMP and SNMP will both send 10 pings and perform an SNMP query. By far, the most efficient status check is SNMP and this option should always be used if you con’t care about tracking historical latency/packet loss.. If you are going to assign an ICMP probe to the device, it doesn’t make any difference from an efficiency standpoint which status check you use.
If a device fails the status check, the device status will be set to Down. This is the only method by which a device can obtain the Down status. Passing the status check will set the status to Good and then all probes will be run. Device status is then inherited from the worst probe – so if four probes return Good and one returns Warning, the device will move into Warning status. The three statuses obtainable from probes are Good, Warning and Bad.

Looking at the Probes tab will allow you to see the last result of a probe, when it was last checked, the status of the probe, the name and the type. You can delete probes from this screen and also add other probes manually using the drop down list at the bottom of the window. Clicking on the Graphs tab will give you access to the history of each probe as well as a few other graphs such as bandwidth usage (for devices set to collect bandwidth data via the BMU) and a status history graph that will allow you to see the status of a device over time.
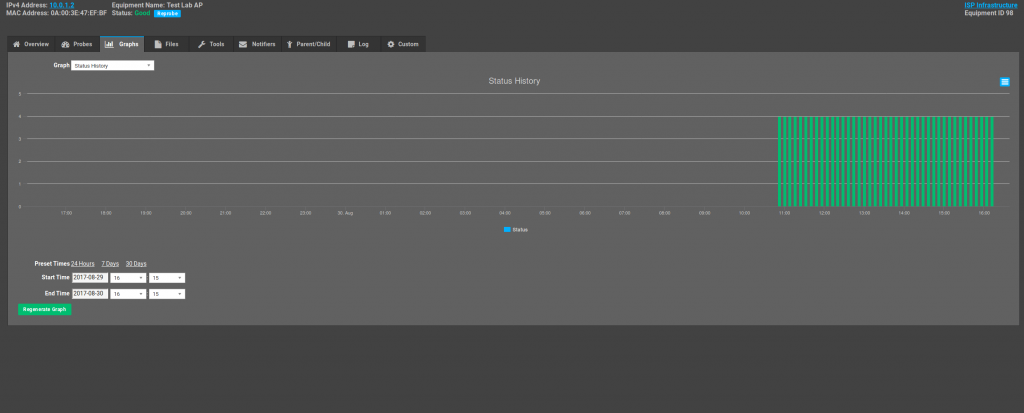
All the graphs are presented in a similar manner and can be scaled over any time period you would like.
Probes are run directly on the Powercode BMU and the data is stored on the Powercode management server. If your Powercode BMU is offline, you will not be able to probe!
Monitoring Settings
There are three settings available under Network > Network Monitoring > Settings
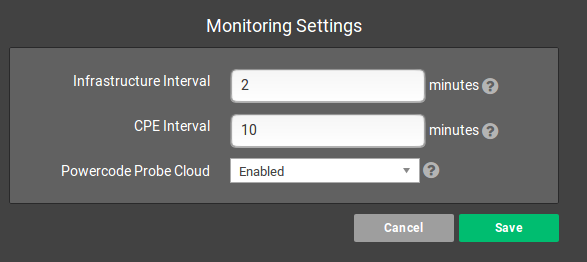
- Infrastructure Interval: How often should Probes ping infrastructure.
- CPE Interval: How often should Probes ping customer point equipment.
- Powercode Probe Cloud: Would you like to share and receive probe templates anonymously with Powercode users.
Failure Notification
Now you have your probes configured, associated with active devices and you’re actively looking at data. It’s time to set up some notifications so you can be alerted when a device moves into a particular status. To do this, we need to create some Notifiers. Click on Network -> Network Monitoring -> Notifiers.
Notifiers can be of two types – Email or PagerDuty. Email based probes are sent by email from the Powercode server. You can configure the From address for these notifiers by updating the Alert Sender field at the top of the page. PagerDuty probes are sent via www.PagerDuty.com and allow you to easily receive emails, SMS or telephone calls on network events as well as configuring escalation policies, on call rotations and more. Please check their website form ore details on their platform.
First, let’s create an email notifier. Click on Add New Notifier.
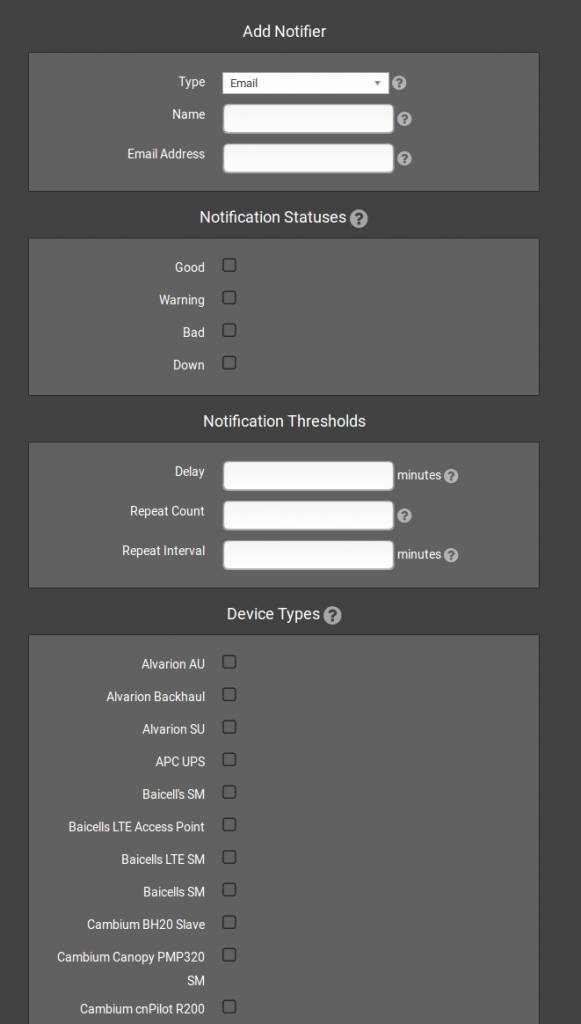
Select Email as the type and input a name for this notifier as well as the email address you want alerts sent to. Select the Notification Statuses you wish this notifier to receive alerts on. For example, if you only check Good and Down, you will only receive emails if a device moves into Good or Down status – a device moving into Warning would not alert you.
The Notification Thresholds allow you to define when you want to be alerted and how often. Delay controls how long a device has to be in a particular status before an alert is sent. For example, if you set the delay to 10 minutes and the device is in Downstatus for 5 minutes before becoming Good again, you would not be notified. The Repeat Count and Repeat Delay allow you to configure how many times a notification would repeat, and the interval between those repeat emails.
Finally, selecting specific Device Types will allow you to associate this particular notifier with certain device types automatically.
The other option is a PagerDuty notifier.
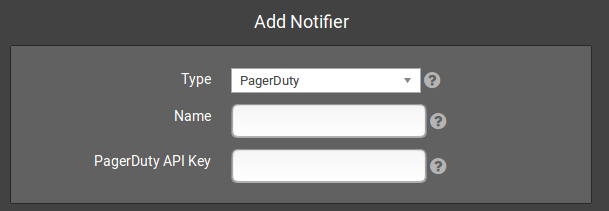
When creating a PagerDuty notifier, you enter the API Key from the PagerDuty website that is associated with the PagerDuty Service you want these alerts to go into. There is no delay or repeat count to configure, as you control the notification intervals and methods directly through PagerDuty.
We have directly integrated the PagerDuty API into Powercode if you choose to use the PagerDuty service. It functions as follows:
- If a device goes into a status that is enabled for the PagerDuty notifier, we will open an incident with PagerDuty.
- If a device moves back into a Good status, we will automatically resolve the PagerDuty incident.
- If paging is suppressed on a device in Powercode, we will automatically acknowledge the PagerDuty incident.
It is also possible to suppress paging on a per device basis if you are using email alerts. Simply navigate to the device and click the Suppress Paging button. This will allow you to suppress pages temporarily (until the device becomes Good again), for a timed period or permanently.
The final important item to note in regards to notifications is that Powercode will automatically check the status of all parent devices before sending a notification. If every parent of a particular device is Down, then no matter the state of the child device, you will not receive a notification. This is helpful if, for example, you make every device at a network location a child of the router that runs that network location. If the router goes offline, you will now receive a single alert rather than alerts for every other device at the site that is dependent on that router. You can configure multiple parents for a device and paging will only be suppressed for children if all parents are down.
